
Every dairy owner who moves to an app hits the same wall on day one: the rate chart. You already have one — maybe a laminated sheet by the milk can, maybe an Excel file your accountant made, maybe a photocopied parchi that's been on the wall for years. It works fine on paper. But to make the app calculate rates for you, that whole chart has to go in. And a full Fat/SNF rate chart is not five numbers. It's a grid — Fat down one side, SNF across the top — and every crossing point is a price. That's easily two, three, even four hundred cells.
Type that by hand and two things happen. It takes hours, and somewhere around cell number 180 your eyes glaze over and you fat-finger a ₹42 into a ₹24. Nobody notices until a farmer's slip looks wrong two weeks later. That one job — copying a chart you already have — is exactly the kind of dull, error-prone work you want a machine to do.
What the AI fill actually does
The idea is simple. Instead of you reading your chart and typing it into the app cell by cell, the AI does the reading. You hand it your existing chart — a photo, a PDF, or an Excel/CSV file — and it reproduces every cell inside Milk Sarthi. It figures out which numbers are Fat values, which are SNF, and which are the prices, then lays them out into the same grid you started with. In a couple of minutes you go from a blank rate-chart screen to a fully filled one, ready to review. No hundreds of taps.
Step 1 — Get your chart ready
First, decide what you're going to feed the AI. You have four choices, and any of them works:
- A clear photo of your paper chart — the laminated sheet or the parchi on the wall.
- A PDF, if your supplier or union gave you the chart as a file.
- An Excel or CSV file, if you or your accountant already keep it in a spreadsheet.
Not sure what a Fat/SNF rate chart is or how it sets the price per litre? That guide walks through it. For now, just have your chart within reach — on the wall, on your phone, or in your files.
Step 2 — Upload or snap it
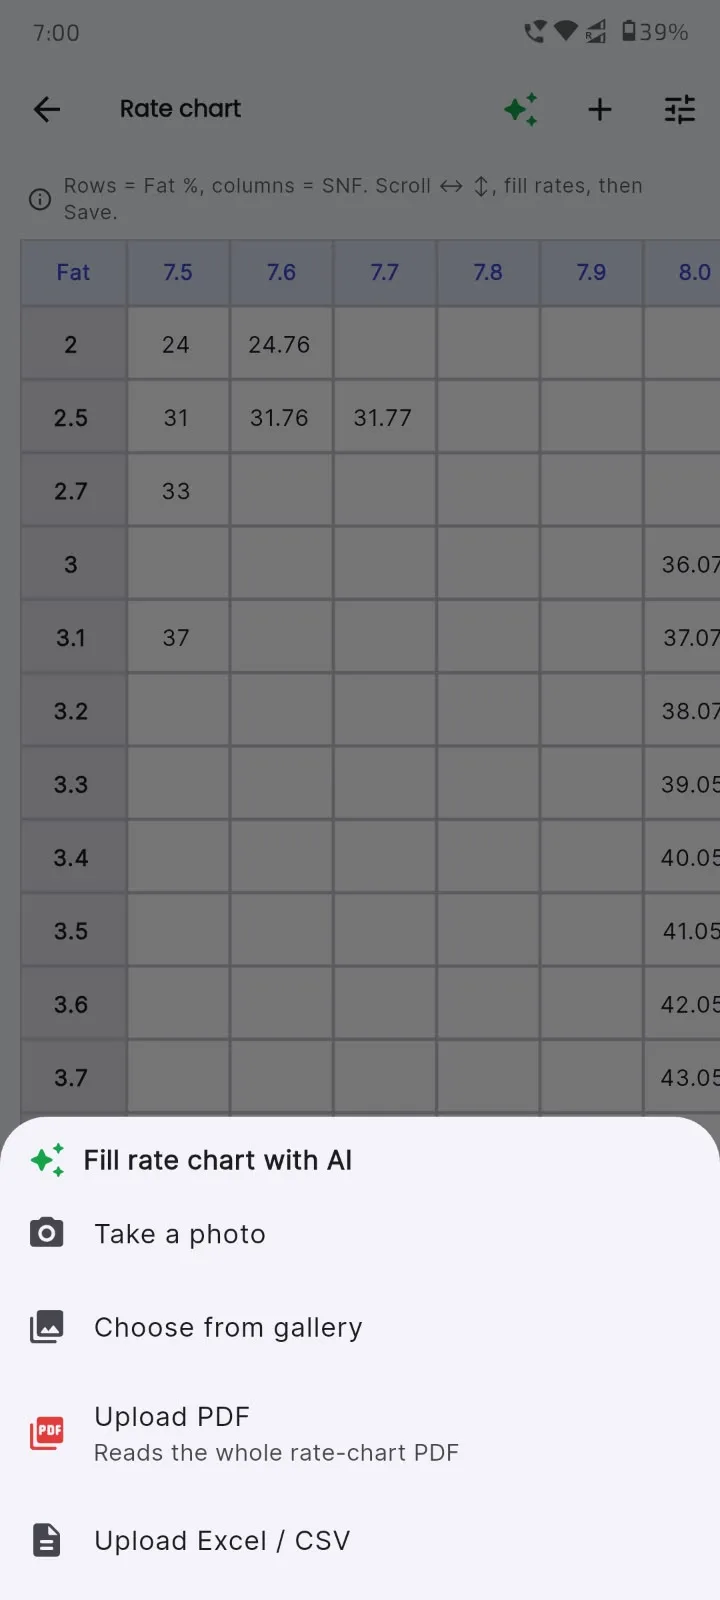
Open Milk Sarthi and go to the Rate chart screen. You'll see the option to fill it with AI, and it gives you the same four paths as your chart:
- Take a photo — point your camera at the chart on the wall.
- Choose from gallery — pick a photo you already have.
- Upload PDF — select the PDF file.
- Upload Excel — select your spreadsheet (Excel or CSV).
Pick whichever matches what you've got. That's the whole input step — one tap and you're done handing it over.
Step 3 — Let the AI fill the grid
Now the AI goes to work. It reads your chart, works out the Fat rows and the SNF columns, and drops the right price into each cell. This is the part that would have taken you an evening — and it wraps up in a minute or two. When it finishes, you're looking at a complete grid: the same rate chart you started with, now living inside the app.
Step 4 — Check and save
Before you commit, give it a quick once-over. Keep your paper chart next to your phone and spot-check a handful of cells — pick a few across the grid and make sure the price matches. If a number looks off, tap it and fix it right there. This takes a minute, and it's worth it: the chart you save is the one every future entry will use, so you want it exactly right. When you're happy, hit Save. From that moment, every entry you record uses this chart to look up the rate — no more mental maths, and the same rule for every farmer.
Tips for a clean read
The better the input, the less checking you'll do. A few things help:
- Good light. Shoot in daylight or under a bright bulb — no shadow falling across the numbers.
- Keep it flat. Press the chart flat against the wall or a table so it isn't curled or bent.
- Headings visible. Make sure the Fat and SNF labels are in the frame, not cropped off the edge.
- Prefer a file when you can. A PDF or Excel/CSV gives the cleanest result because the numbers are already crisp — there's no photo blur to read through.
No printed chart? Build one
Maybe you don't have a chart to upload at all — you've been going on a flat rate or working it out in your head. That's fine. In that case you can build one inside the app instead: set a base rate and the increments for Fat and SNF, and Milk Sarthi generates the full grid for you. Then tweak any cell you like. Either way — upload or build — you end up with a complete chart. You can see how the numbers come together with our free Fat/SNF rate calculator, and the features page shows where this fits with the rest of the app.
Key takeaways
- A Fat/SNF rate chart is a grid of hundreds of cells — one price for every Fat × SNF pairing.
- Milk Sarthi's AI reads your existing chart from a photo, PDF or Excel/CSV and fills the entire grid in minutes.
- You review and save — spot-check a few cells, fix anything odd, then it applies to every entry.
- No chart yet? Build one from a base rate and increments, then adjust.
- It's a free Android app from Apna Infotech.
The point of all this is time. Setting up your rates used to be the boring gate you had to pass before the app was any use to you. Now it's a photo and a two-minute check. Get the chart in, save it once, and let Milk Sarthi do the lookup on every entry from then on.