
Walk up to any collection point in the morning and you will hear the same two words over and over: Fat and SNF. They decide how much every farmer gets paid. Yet a lot of dairy owners run the whole business on a feel for these numbers without ever being shown, in plain words, what they mean. Let's fix that.
What is Fat?
Fat is exactly what it sounds like — the percentage of milk fat in the milk. It is the part that turns into cream, ghee and butter, so it carries a lot of the value. Cow milk usually tests somewhere around 3.5% to 4.5% Fat. Buffalo milk is much richer, often 6% to 8%. Higher Fat means richer milk, and richer milk earns a higher rate per litre.
What is SNF?
SNF stands for Solids-Not-Fat. Milk is mostly water. If you removed all the water and all the fat, what's left — the proteins, the lactose (milk sugar) and the minerals — is the SNF. It is a good sign of how "solid" and unwatered the milk is. A typical SNF is around 8.3% to 8.7% for cow milk and a little higher for buffalo. When milk is watered down, the SNF drops, which is why buyers watch it closely.
So Fat and SNF together answer one question: how good is this milk? Fat tells you how rich it is; SNF tells you how much real milk-solid is in it rather than water. Pay for both, and you pay for quality.
Why the same litres can pay differently
Imagine two farmers each bring 10 litres one morning.
- Farmer A: 10 L, Fat 4.0, SNF 8.5
- Farmer B: 10 L, Fat 3.2, SNF 8.0
Same litres, but Farmer A's milk is richer and less watery. On a Fat/SNF rate chart, A's milk might land on ₹46 per litre and B's on ₹38 per litre. That's ₹460 for A and ₹380 for B — an ₹80 difference on the same 10 litres, and it is completely fair, because A simply delivered better milk. This is the heart of quality-based pricing, and it's why a plain flat rate ("₹40 for everyone") quietly overpays weak milk and underpays your best farmers.
How a rate chart turns quality into a price
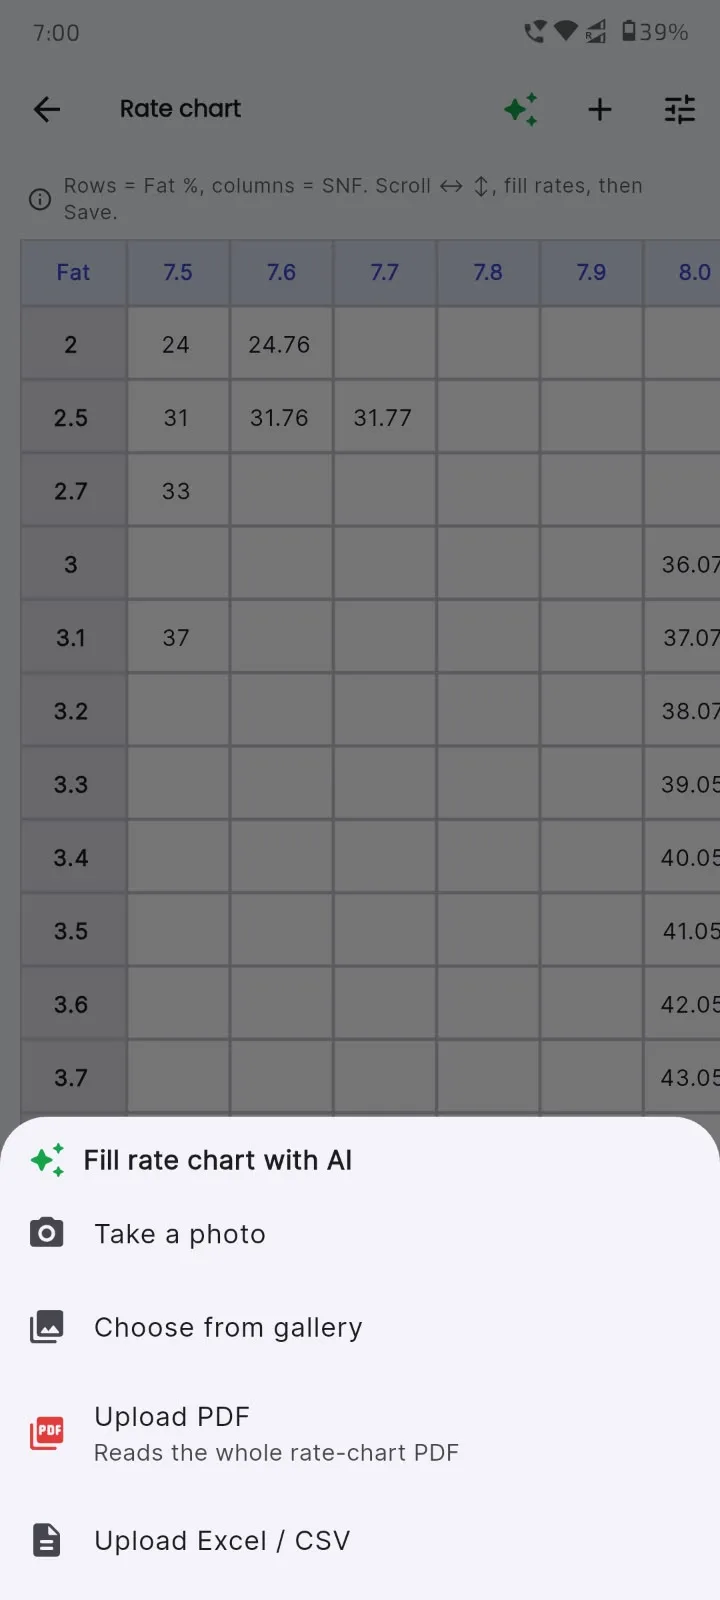
A Fat/SNF rate chart is just a grid. One side lists Fat values (say 3.0, 3.1, 3.2 … up to 8.0) and the other lists SNF values (7.5, 7.6, 7.7 …). Every cell where a Fat row meets an SNF column holds a price per litre. When the milk is tested, its Fat and SNF point to exactly one cell, and that cell is the rate. Multiply the rate by the litres and you have the amount to pay:
Rate per litre (from chart) × Litres = Amount payable
The chart is the rulebook everyone agrees on. Once it is set, the price is no longer an argument or a guess — it is a lookup. The catch is that a full chart can have hundreds of cells, and filling it by hand in an app is slow and error-prone. That's the one job worth handing to software.
Doing the maths automatically
This is where an app earns its place. In Milk Sarthi you set your rate chart once — and if you already have a printed or Excel chart, the app's AI can read it and fill the entire grid for you in minutes instead of hours. After that, every time you enter Fat, SNF and litres, the app finds the right cell, shows the rate per litre, and calculates the amount instantly. No mental maths at 5 a.m., no wrong sums, and the same rule for every farmer, every day.
Want to sanity-check a rate before you commit a chart? Our free Fat/SNF milk rate calculator lets you punch in Fat, SNF and litres and see the price per litre and total on the spot.
Key takeaways
- Fat = richness of the milk (cream/ghee value).
- SNF = the real milk-solids (protein, lactose, minerals) — how "unwatered" it is.
- Paying on Fat and SNF means paying for quality, so the same litres can fairly earn different amounts.
- A rate chart maps every Fat × SNF combination to a price, turning quality into a simple lookup.
- Let software store the chart and do the lookup — it's faster, fairer and removes arguments.
Once your farmers see that the number is coming from a fixed chart and a printed slip — not from the owner's memory — trust goes up and disputes go down. That, more than anything, is what quality-based pricing buys you.